- Article
- Source: Campus Sanofi
- 23 Oct 2023
Evolving role of AI in the diagnosis of Fabry disease
Recognition of pre-hypertrophic cardiac involvement in Fabry disease using automated ECGs
An analysis comparing ECGs from 1496 healthy individuals to 142 patients with Fabry disease (without LVH) identified nine ECG parameters that were significantly different between the groups and could be useful for the purpose of screening the very early stages of cardiomyopathy in Fabry disease.1
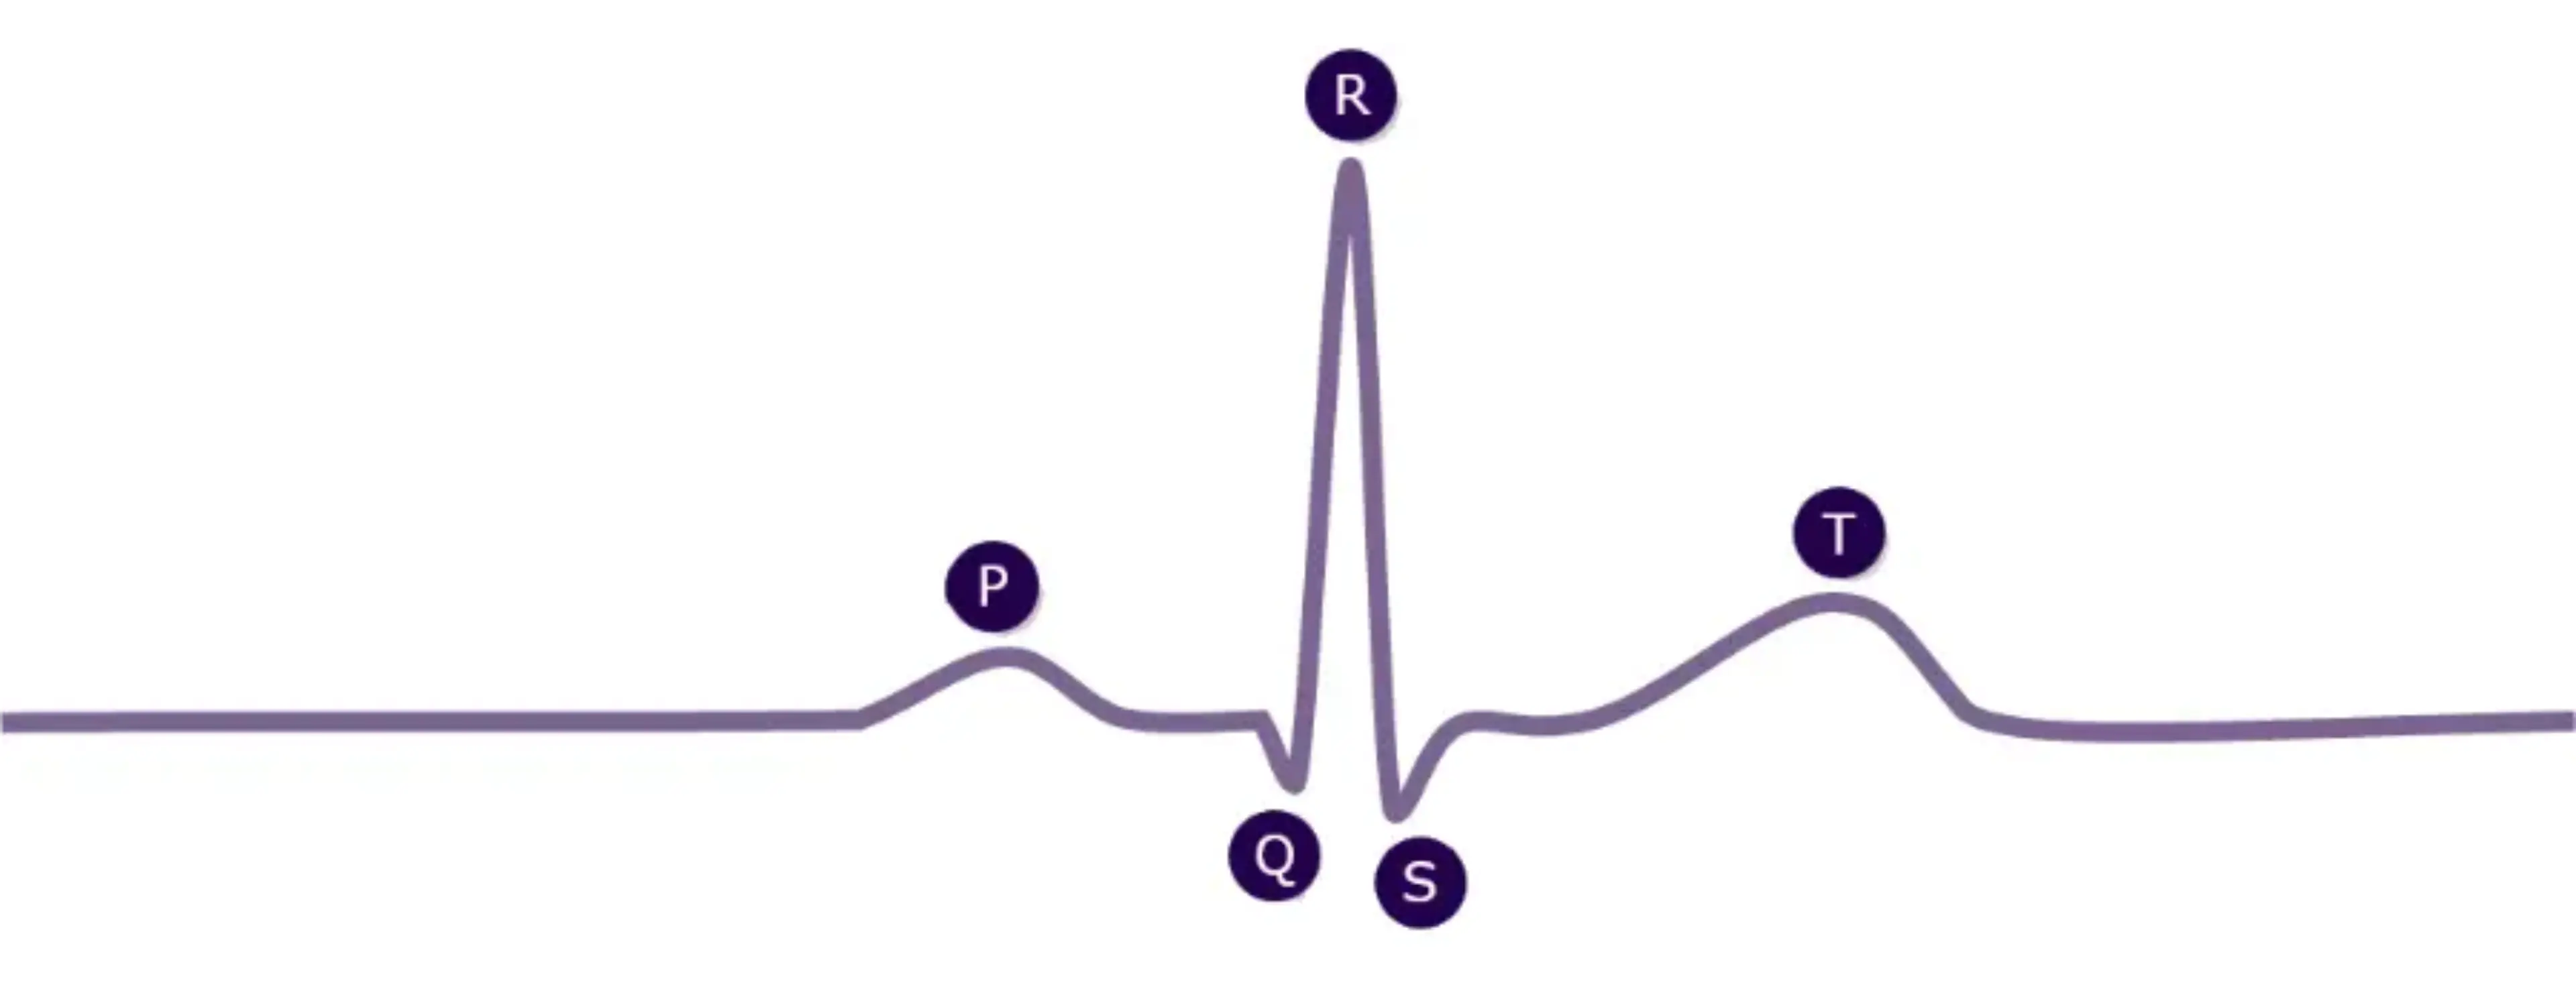
Click the buttons below to explore the parameters that match with the letters on the ECG.
| P wave morphology in the precordial lead V3 (categorical classification: 1=single upright, −1=single inverted, 2=biphasic, leading positive, −2=biphasic, leading negative) |
| Amplitude of the positive component of the P wave in lead DI (P+ Amp I, μV) |
| P wave area in the precordial lead V1 (P Area V1, μV-milliseconds [μV. ms], defined as the algebraic sum of both the positive and negative areas or either alone if the P wave is not biphasic) |
| QT dispersion (ms) defined as the difference between the shortest and longest QT interval in the 12 lead ECG |
| 4/8 QRS (time-normalized QRS spatial velocity at 4/8 of the total QRS duration, μV/ms) |
| QT dispersion (ms) defined as the difference between the shortest and longest QT interval in the 12 lead ECG |
| 4/8 QRS (time-normalized QRS spatial velocity at 4/8 of the total QRS duration, μV/ms) |
| Amplitude of the ST segment in the precordial lead V2 (ST60 Amp V2, μV) |
| Duration of the S wave in the precordial lead V1 (S Dur V1; ms) |
| Amplitude of the ST segment in the precordial lead V2 (ST60 Amp V2, μV) |
| QT dispersion (ms) defined as the difference between the shortest and longest QT interval in the 12 lead ECG |
Clinical progression and patient outcomes

ECG, electrocardiogram; LVH, left ventricular hypertrophy
References
- Namdar M, et al. Int J Cardiol. 2021;338:121–6.
MAT-XU-2300310 (v4.0) Date of preparation: October 2023