Impact of Time-In-Range on Diabetes Management

Beyond HbA1C, It is time to think Time-in-Range
Optimizing Time-in-range is fundamental to effective Diabetes management and to help reduce the risk of the negative consequences for your patients1-5
.png)
Each 10% drop in Time-in-Range (TIR) was associated with increased frequency of
Time-in-range is an important physical and emotional measure of success for people with T1DM and T2DM6,7
Up to 57% of people with T1DM and T2DM ranked TIR as the measurable therapy outcome that had the biggest impact on daily life with diabetes6†† Up to 54% ranked TIR as the highest driver of a positive mindset6‡‡
ADA and the International Consensus on TIR recommend reducing glycemic variability and optimizing TIR as a key aspect of effective diabetes management in people with T1DM and T2DM 8,9
Optimizing HbA1c to <7.0%8,10 and reducing glycemic variability:
TIR>70% and %CV≤36%8,10 helps achieve better patient outcomes2,4,5,7,8
*Post hoc analysis using the DCCT dataset to evaluate the association of TIR of 70–180 mg/dL (3.9–10 mmol/L) with the development or progression of retinopathy and microalbuminuria to validate TIR as a metric. Criteria for the retinopathy outcome were met by n=271/1,440 (19%), and for the microalbuminuria outcome were met by n=116/1,283 (9%). Mean TIR for 7-point profiles for 1,440 people was 41 ± 16%. Adjusted HR (95% CI) for retinopathy: 1.64 (1.51 to 1.78); adjusted HR (95% CI) for microalbuminuria: 1.40 (1.25 to 1.56). From discrete Cox proportional hazards regression models using a time-dependent version of each glucose metric stratified by the ETDRS level of retinopathy at baseline and adjusted for the pre-DCCT glycemic exposure represented by the pre-existing duration of diabetes separately for the primary and secondary cohorts; p<0.001.2
† Data from a prospective observational cohort study which evaluated the association of TIR of 70–180 mg/dL (3.9–10 mmol/L) with microvascular diabetes outcomes, including peripheral neuropathy; 62 out of 105 participants with a total MNSI questionnaire score ≥2 were defined as having distal peripheral neuropathy, including 51 with CKD and 11 controls; CKD patients defined as having eGFR <60mL/min/1.73m2. Odds ratio (95% CI): 1.25 (1.02 to 1.52). Adjusted for age, sex and race.3
‡ A prospective cohort study (N=6,225) evaluating the link between TIR of 70–180 mg/dL (3.9–10 mmol/L) with all-cause and cardiovascular mortality, with the objective of validating TIR as surrogate marker of long-term adverse clinical outcomes. Adjusted HR (95% CI) for all-cause mortality: 1.08 (1.05 to 1.12); adjusted HR (95% CI) for CV mortality: 1.05 (1.00 to 1.11). From restricted cubic spline nested in time-dependent Cox model. Adjusted for age, sex, smoking, diabetes duration, BMI, systolic blood pressure, triglycerides, HDL cholesterol, LDL cholesterol, history of cancer, history of CVD, and using antihypertensive drugs, aspirin, and statins.4
#Post hoc study using data from the devote study from 5,644 people with T2DM who had an 8-point glucose profile. Individual TIR was derived as the proportion of the 8-point glucose profile within range (derived TIR). A Cox model was used to estimate the association between derived TIR and time to first MACE, severe hypoglycaemic episode and microvascular event (retinopathy and CKD). HRs (95% CI) for MACE: 0.69 (0.52 to 0.91) for TIR>70% vs TIR ≤50%; 0.91 (0.66 to 1.24) for TIR >70% vs TIR >50–≤70% (overall association p<0.01). HR (95% CI) for microvascular event: 0.60 (0.43 to 0.85) for TIR>70% vs TIR ≤50%; 0.73 (0.49 to 1.09) for TIR >70% vs TIR >50–≤70% (overall association p<0.019). Hazard ratios were consistent when analyses were adjusted for baseline characteristics.5
**TIR >70% vs ≤50%. HR (95% CI) vs TIR ≤50% for time to first severe hypoglycemia: 0.54 (0.40 to 0.73).5
††Online survey of 3,461 people with T1DM (n=1,026) or T2DM (n=1,154 on insulin; n=1,281 not on insulin). The survey presented respondents with 25 questions investigating patients’ perceptions of the success of current diabetes drugs and devices; which factors have the biggest impact on patients’ daily lives and which changes would have the biggest positive impact on diabetes management and mindset; and mental well-being, QoL, desired improvements for future therapies, relationships with health care providers, and the concerns of loved ones. The survey was conducted from 17–22 August.6
‡‡Food choices were rated by all groups (range 63% to 67% of the groups) as the greatest factor having an impact on daily life with diabetes, but TIR emerged as the measurable therapy outcome that had the biggest impact on daily life with diabetes for all groups of respondents (range 41% to 57%).6
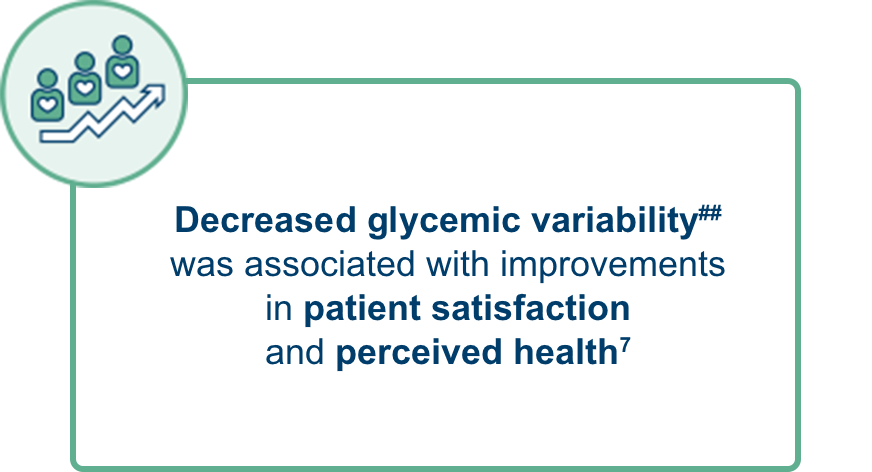
##Including intra-day mean glucose, glycemic variability, and glucose levels after meals and overnight. Based on a multicentre, randomised, crossover trial in adults with T1DM (n=82) and T2DM (n=306). Participants received basal-bolus regimen of insulin glargine plus premeal insulin glulisine (n=192) or premix analogue insulin (n=196). Participants were then crossed over to the other treatment at 12 weeks and continued for another 12 weeks.7
HbA1c, Hemoglobin A1c; TIR, Time-in-Range; T1DM, Type 1 Diabetes Mellitus; T2DM, Type 2 Diabetes Mellitus; CKD, Chronic Kidney Disease; CV, Cardiovascular; MACE, Major Adverse Cardiovascular Events; %CV, Coefficient of Variation; DCCT, Diabetes Control and Complications Trial; HR, Hazard Ratio; CI, Confidence Interval; ETDRS, Early Treatment Diabetic Retinopathy Study; eGFR; Estimated Glomerular Filtration Rate; BMI, Body Mass Index; HDL, High Density Lipoprotein; LDL, Low Density Lipoprotein; CVD, Cardiovascular Disease; QoL, Quality of Life.
- Battelino T, et al. Diabetes Care. 2019;42:1593–603;
- Beck RW, et al. Diabetes Care. 2019;42:400–5;
- Mayeda L, et al. BMJ Open Diab Res Care. 2020;8:e000991;
- Lu J, et al. Diabetes Care. 2021 Feb;44(2):549-555;
- Bergenstal RM, et al. Presented at the American Diabetes Association, 80th Scientific Sessions; June 12–16, 2020. 21-LB;
- Runge AS, et al. Clin Diabetes. 2018;36:112–119;
- Testa MA, et al. J Clin Endocrinol Metab. 2012;97:3504–14;
- ADA. Diabetes Care. 2021;44(Suppl. 1):S73–S84;
- Monnier L, et al. Diabetes & Metabolism. 2018;44:313–9;
- Danne T, et al. Diabetes Care. 2017;40:1631–40.
.jpg1/jcr:content/image%20(20).jpg)