.svg)
The BRIGHT Study
The first head-to-head RCT designed to compare the efficacy and safety of Gla-300 with IDeg-100 in participants with T2DM1
Background
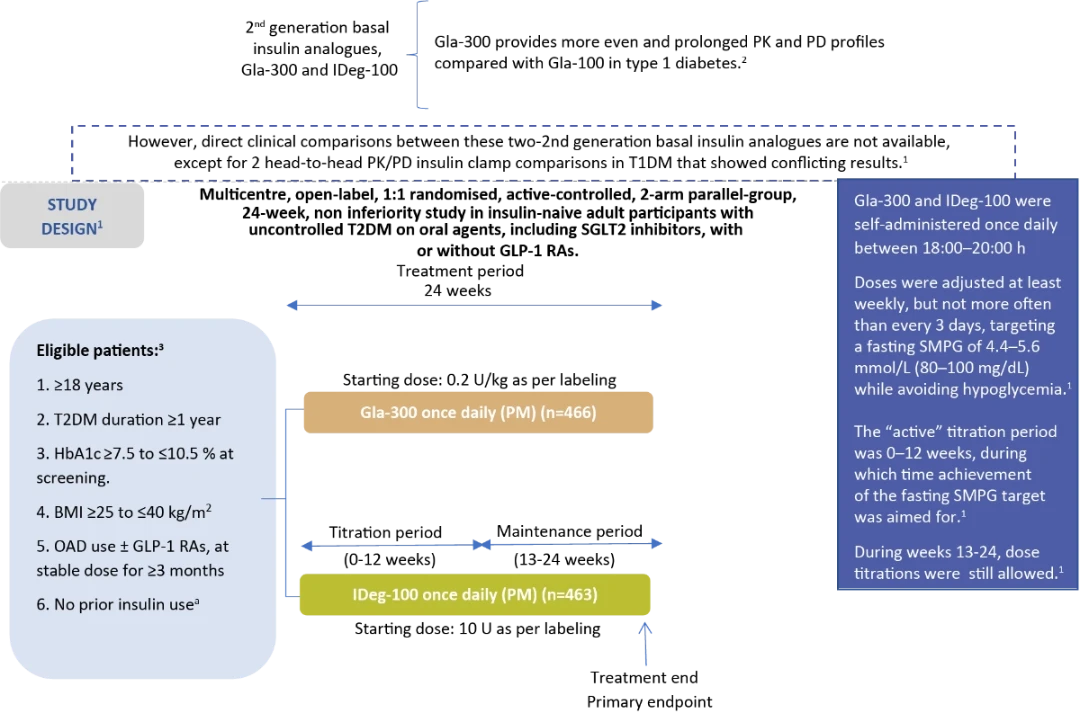
Stratification by :
- Hb1A1c at screening (<8.0/≥8.0 % [<64/≥64 mmol/mol])
- Use of SU or meglitinides at screening (Yes/No)
aWith the exception of a maximum of 8 consecutive days or 15 days total during the last year prior insulin use
Overall baseline characteristics were similar between treatment groups1
|
Gla-300 n=466 |
IDeg-100 n=463 |
|
| Known T2DM duration, years | 10.5 ± 6.1 | 10.7 ± 6.5 |
| HbA1c % | 8.7 ± 0.8 | 8.6 ± 0.8 |
Randomised population. Data expressed as mean ± standard deviation unless stated otherwise
Background therapies were not changed during the study unless safety concerns necessitated dose reduction or discontinuation.1
Gla-300: insulin glargine 300 U/mL; IDeg-100: insulin degludec 100 U/mL; PK: pharmacokinetic; PD: pharmacodynamic; RCT: randomized clinical trial; T2DM: type 2 diabetes mellitus; T1DM: type 1 diabetes mellitus; BMI: body mass index; SGLT2: sodium-glucose cotransporter-2; GLP-1 RA: glucagon-like peptide-1 receptor agonist; OAD: oral antihyperglycemic drug; SMPG: self-monitored plasma glucose; SU: sulfonylureas

Pre-defined endpoints1
Primary efficacy endpoint:
Change in HbA1c from baseline to week 24
- Analysed using a MMRM approach, adjusted for covariates including baseline HbA1c
- Non-inferiority margin was 0.3 % (HbA1c units)
Secondary efficacy endpoints:
- Change in FPG, fasting SMPG, and eight-point SMPG profiles from baseline to week 24
- Change in variability of 24-h SMPG, based on eight-point profiles
- Percentage of participants reaching target HbA1c <7.0% (<53 mmol/mol) at week 24
- Percentage of participants reaching target HbA1c <7.0% (<53 mmol/mol) at week 24 without confirmed hypoglycemia (≤70 mg/dL and <54 mg/dL)
Safety endpoints:
The incidence and event rates of hypoglycemia during the 24-week on-treatment period, the active titration period (weeks 0–12), and the maintenance period (weeks 13–24).
- Body weight and adverse events (AEs).
Results
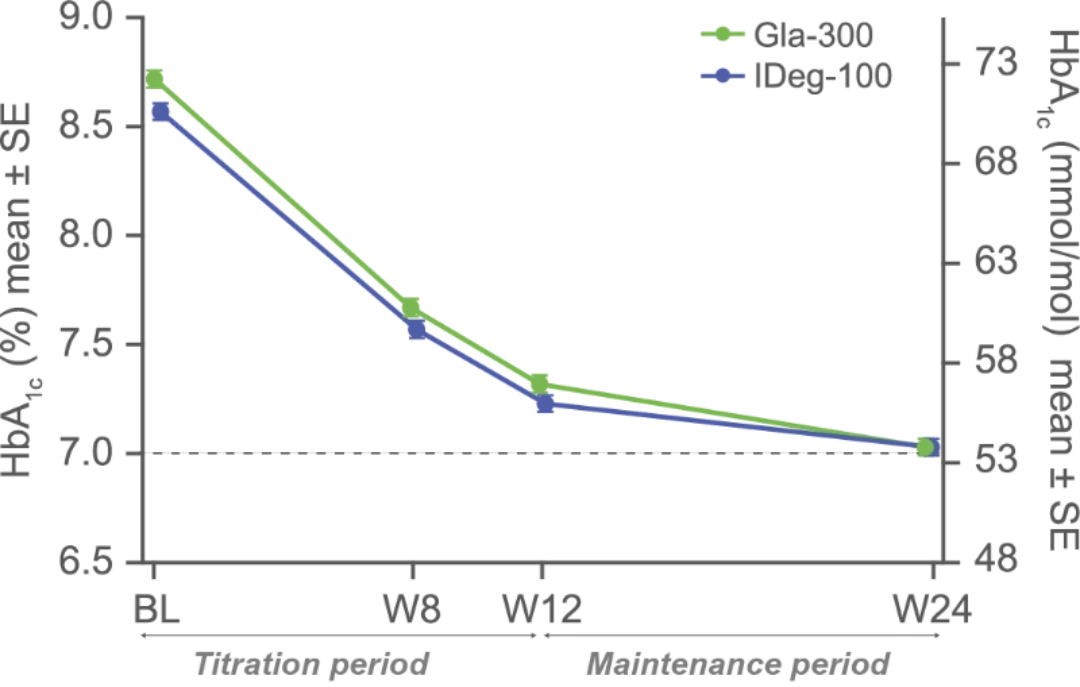
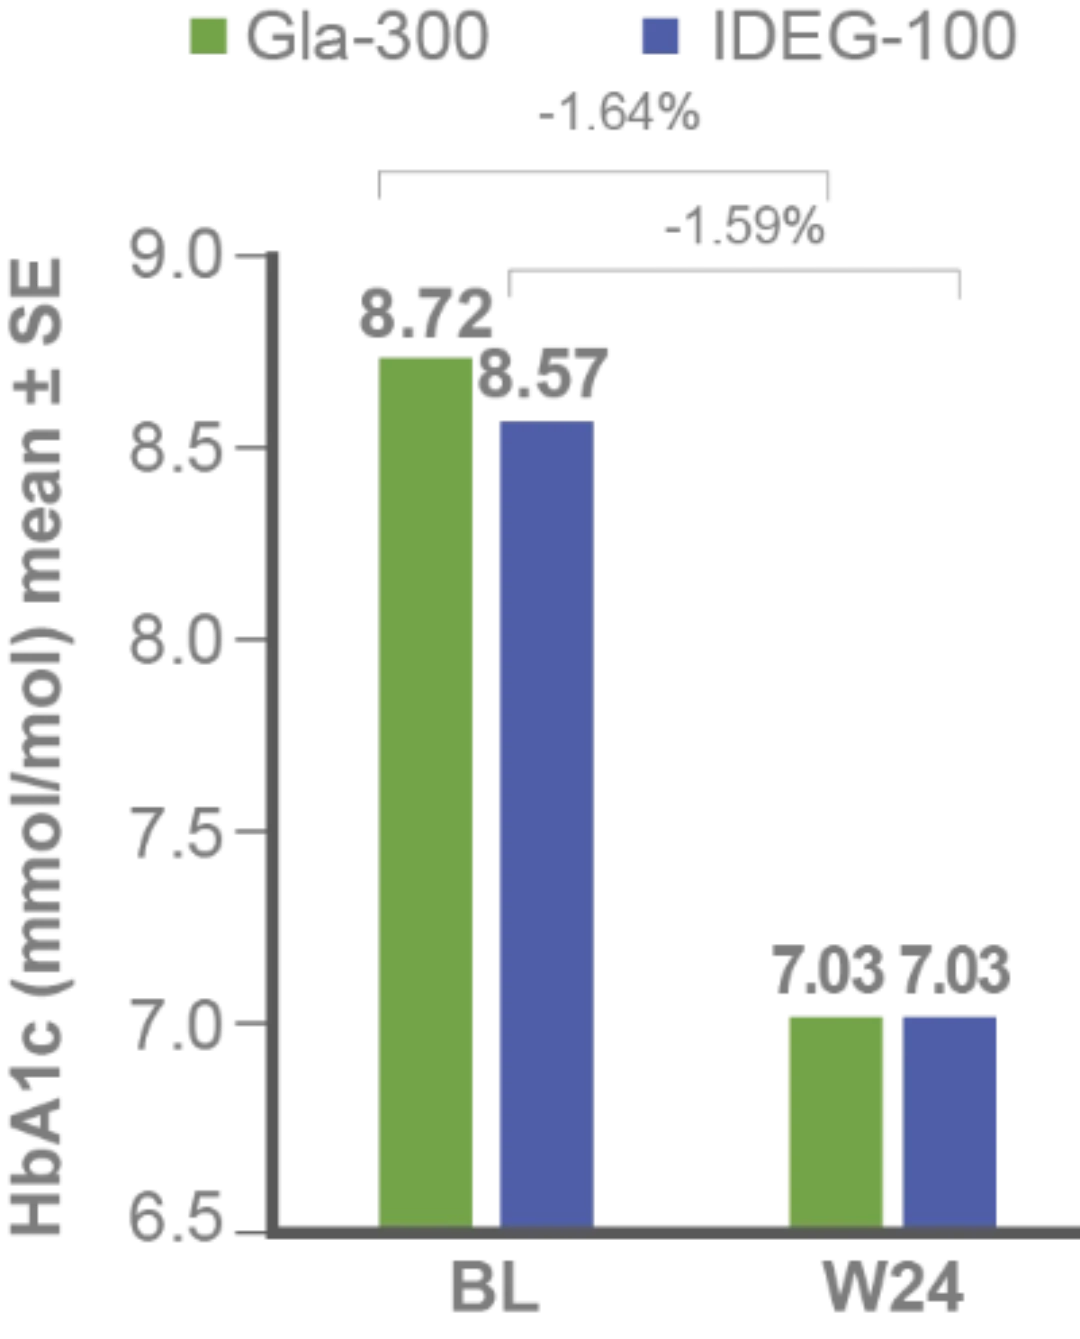
Primary efficacy endpoint:
Non-inferiority of Gla-300 vs IDeg-100 in HbA1c reduction at study end1
LS mean difference for Gla-300 vs IDeg-100: -0.05% (95% CI -0.15 to 0.05) (-0.6 mmol/mol [-1.7 to 0.6]), non-inferiority p-value <0.0001
Secondary efficacy endpoints:
FPG and fasting SMPG reduction with Gla-300 vs IDeg-100 from baseline to study end1
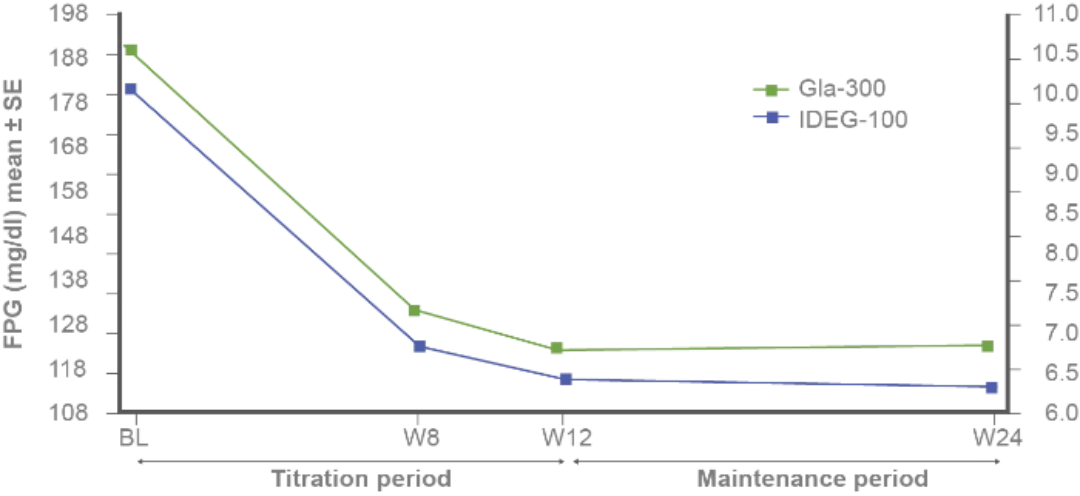
FPG LS mean difference from baseline to week 24 for Gla-300 vs IDeg-100: 7.7 mg/dL (95% CI: 2.7–12.7)
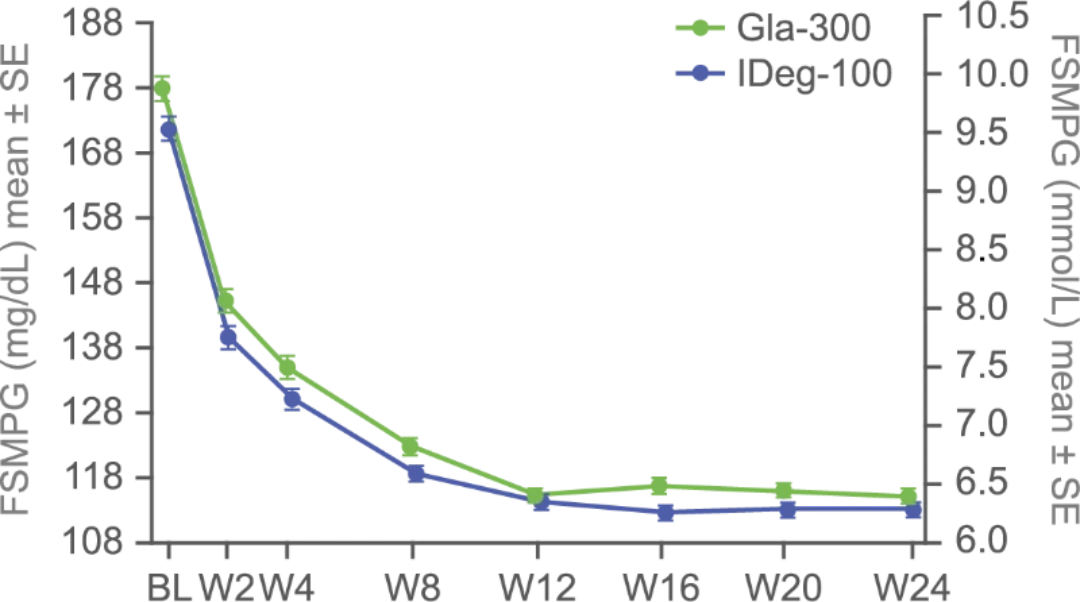
Fasting SMPG LS mean difference from baseline to week 24 for Gla-300 vs IDeg-100: 1.1 mg/dL (95% CI: -1.9 to 4.1)
Similar 8-point (24-hr SMPG) variability profiles between both groups at baseline and study end1
Similar variability of 24-h SMPG at baseline and week 24 with both treatments.1
.webp/jcr:content/Asset%207%20(1).webp)
8-point SMPG profiles
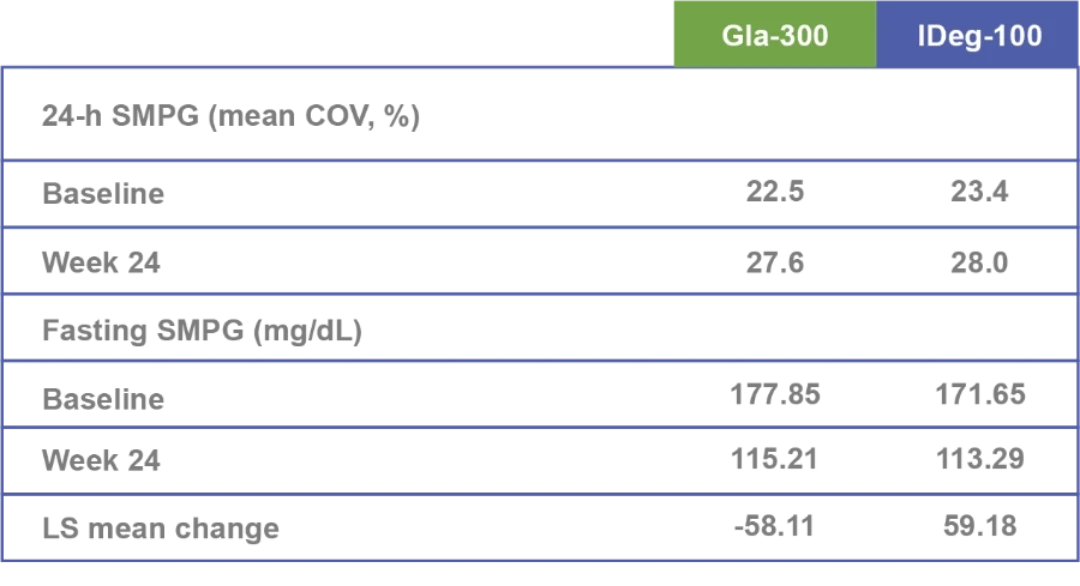
Within-day plasma glucose variability
Safety endpoints:
.webp/jcr:content/Asset%201%20(1).webp)
Treatment-emergent adverse events1
- Individual agents offer CV and/or renal protection beyond blood pressure lowering alone.1,2,3
- No specific safety concerns were reported
- There was one death in the Gla-300 group (adenocarcinoma of the colon)
- Only one episode of severe hypoglycemia occurred during the entire study (female, 49 years old, treated with metformin).
Confirmed hypoglycaemia included documented symptomatic or asymptomatic hypoglycaemia (≤70 mg/dL or <54 mg/dL), and severe events if any; only 1 participant experienced severe hypoglycaemia (1 event), in the Gla-300 group, due to a skipped evening meal and not reducing her insulin dose after a non-severe event 2 days earlier. All p-values presented are nominal.1 Safety population (Gla-300, n=462; IDeg-100, n=462)3
FPG: fasting plasma glucose; MMRM: mixed model for repeated measurements; BL: baseline; LS: Least square; SE: standard error; W: week; CI: confidence interval; SD: standard deviation
Findings:
.jpg/jcr:content/47404528185.png)
Confirmed hypoglycemia (≤3.9 mmol/L) incidence by time of day4
Background antihyperglycemic therapies had no impact on the comparable efficacy and hypoglycemia profiles of Gla-300 and IDeg-100.5
.jpg/jcr:content/Asset%2011-100%20(1).png)
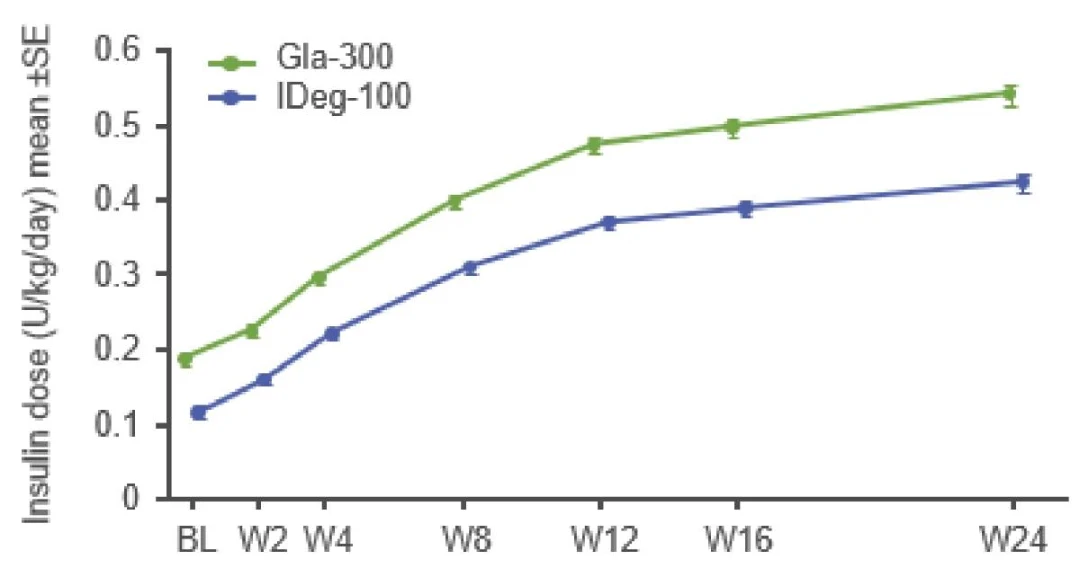
Mean daily insulin doses3
Mean (± SD) change in body weight from baseline to week 241
Gla-300
- 2.0 kg (±3.8)
IDeg -100
- 2.3 kg (±3.6)
Clinical implications
-
Comparable glycemic control was achieved alongside similarly low overall incidence and rates of hypoglycemia in both insulin groups throughout the treatment period.1
-
According to the ADA 2022 Guidelines for Medical Care in Diabetes, insulin doses should be titrated to meet individualized glycemic targets and to avoid hypoglycemia.6
-
Patients who experience hypoglycemia soon after initiating basal insulin are at greater risk of discontinuation of their basal insulin therapy and hospitalization than those who remain free of hypoglycemic events.7
-
Glycaemic control and hypoglycaemia incidence at 3 months were associated with long-term glycaemic control and hypoglycaemia incidence, respectively.8
-
Gla-300 was associated with lower incidence and rates of anytime (24-h) confirmed hypoglycemia ≤70 and <54 mg/dL) than IDeg-100 during the 0–12-week period when most of the insulin dose titration and plasma glucose reduction occurred.1
Conclusion
- BRIGHT was the first direct comparison of Gla-300 vs IDeg-100:
- Similar glycaemic control for HbA1c and fasting SMPG
- Similar variability in 24-h SMPG and fasting SMPG
- No difference between treatments over 24 weeks was seen in the incidence of confirmed hypoglycemia at the <54 mg/dL threshold.1
- Lower incidence and annualized rates of anytime (24-h) confirmed hypoglycemia (≤70 and <54 mg/dL) were observed with Gla-300 versus IDeg-100 during the inial titration period (0–12 weeks).1
ADA: American Diabetes Association
References
-
Rosenstock J, Cheng A, Ritzel R, et al. More Similarities Than Differences Testing Insulin Glargine 300 Units/mL Versus Insulin Degludec 100 Units/mL in Insulin-Naive Type 2 Diabetes: The Randomized Head-to-Head BRIGHT Trial. Diabetes Care. 2018;41(10):2147-2154.
-
Becker RH, Dahmen R, Bergmann K, Lehmann A, Jax T, Heise T. New insulin glargine 300 Units · mL-1 provides a more even activity profile and prolonged glycemic control at steady state compared with insulin glargine 100 Units · mL-1. Diabetes Care. 2015;38(4):637-43.
-
Rosenstock J, Cheng A, Ritzel R, et al. More Similarities Than Differences Testing Insulin Glargine 300 Units/mL Versus Insulin Degludec 100 Units/mL in Insulin-Naive Type 2 Diabetes: The Randomized Head-to-Head BRIGHT Trial. Diabetes Care. 2018;41(10):2147-2154.
-
Cheng A, Harris S, Giorgino F, et al. Similar glycaemic control and less hypoglycaemia during active titration after insulin initation with glargine 300 units/mL and degludec 100 units/mL: A subanalysis of the BRIGHT study. Diabetes Obes Metab. 2020;22(3):346-354.
-
Roussel R, Rosenstock J, Pettuus J, et al. Impact of background antihyperglycemic therapy on insulin glargine 300 U/mL (Gla-300) vs. insulin degludec 100 U/mL (IDeg-100) in insulin-naïve people with T2DM from the BRIGHT randomized study. Diabetes. 2018;67(Supplement_1).
-
American Diabetes Association. Standards of Medical Care in Diabetes—2022. Diabetes Care. 2022;45(Suppl 1):S1-2. Available at: https://a- da.silverchair-cdn.com/ada/content_public/journal/- care/issue/45/supplement_1/6/standards-of-care-2022-copyright-stamped-updated-01062022.pdf?Expires=1644932281&Signature=0seWKx jFTTRBey4ApIGXg-Cv9TVjkb1zugZm-PqSfz40jDh9IfaJhjzAa5LofV7vA-jZMBUie9ZtRjtvKsihp3AYn4PC6yBgK4j5reixQz8QyZSlp5Jrjo245zTqtAUWn VgQoJxpWakdhuKYnwOS8OKQTzLdQXR8Rj~rwTFoHNNKhuC04LhJ3nR0mh4ykblD~G2adicbyVG-PDRWaOY6x~qHlbJ1YPV0KeDaeXayqneJkV5W azu9AlZZvBcxbnUja9PyHSmS~7UAL-4xktkzPMwFpWy5ABZSl-c51~v5g2GZtWy6t-E3frDE7NdfHdxnlinpJh~Fo1wGVHKK46VDnw__&Key-Pair-Id= APKAIE5G5CRDK6RD3PGA. Last accessed: 8/2/2022.
-
Dalal MR, Kazemi MR, Ye F. Hypoglycemia in patients with type 2 diabetes newly initiated on basal insulin in the US in a community setting: impact on treatment discontinuation and hospitalization. Curr Med Res Opin. 2017;33(2):209-214.
-
Mauricio D, Meneghini L, Seufert J, et al. Glycaemic control and hypoglycaemia burden in patients with type 2 diabetes initiating basal insulin in Europe and the USA. Diabetes Obes Metab. 2017;19(8):1155-1164.
Approved by Egyptian Drug Authority: SF0065OA69/052022. Invalidation date: 22/05/2024. Kindly report any violated online promotional, educational and awareness material not having this message to The General administration for Regulation of Marketing & Advertising Materials at: www.edaegypt.gov.eg
MAT-EG-2200279